

We've originated over $725 million in loans.
Historical performance through Q3 2018
Cumulative Loans Originated Since Inception
We are experiencing sizable gains in loan origination volume, which translates into greater investment opportunities for our investors.
As of Q3 2018, we have originated over $725 million in loans.
Current Stats
Through Q3 2018
Loans Originated:
$725,000,000+
Value of Properties Funded:
$1,160,000,000+
Total Funds Returned to Investors:
$185,000,000+
-
1571
Number of Loans Funded
-
66.96%
Weighted Average Day 1 LTV
-
10.56%
Average APR for Investors
-
$457,000
Average Loan Size
*Past performance is not indicative of future performance. APR for Investors will depend on loan selection and investor rates available.
Geographical Diversification
Patch of Land is able to fund real estate projects nationwide across 44 states. States where Patch of Land is able to lend are marked in green.
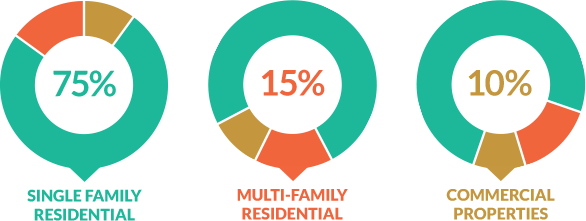
Types of Projects Patch of Land Funds
We offer loans on a mix of property types including single-family residential (75%), multi-family residential (15%), and commercial properties (10%).
Definitions:
Loans Originated - The total loan dollar value for all loans originated, including loans funded or referred to strategic partners by Patch of Land.
Loans Funded - The total loan dollar value for all loans funded by our lending entity, Patch of Land Lending, LLC.
Total Funds Returned to Investors - The total dollars returned to investors for closed loans including principal, interest, late fees, extension fees, and default interest.
Number of Loans Funded - The total count of all loans funded by Patch of Land Lending, LLC.
Weighted Average Day 1 LTV - The loan-to-value based on the initial loan disbursement amount divided by “as-is” value, weighted by total loan amount. This calculation applies to all loans funded since April 2015 based on data availability.
Realized Rate of Return - The return investors have actually experienced across all paid off loans based on the weighted average internal rate of return (IRR). The IRR calculation is based on loan cash flows inclusive of principal, interest, late fees, extension fees, default interest, and gains/losses on principal. Actual realized gains/losses as of Q3 2017 equals 0.00% of Loans Funded.
Average Loan Size - Calculated based on the total dollar value of Loans Funded divided by the Number of Loans Funded.
Some figures reflect data not limited to projects listed on www.patchofland.com
